Compare plans
Choose one of the three options and find what fits for you.
Control Valve App
Valve App Basic
Valve App Premium
Valve App Enterprise
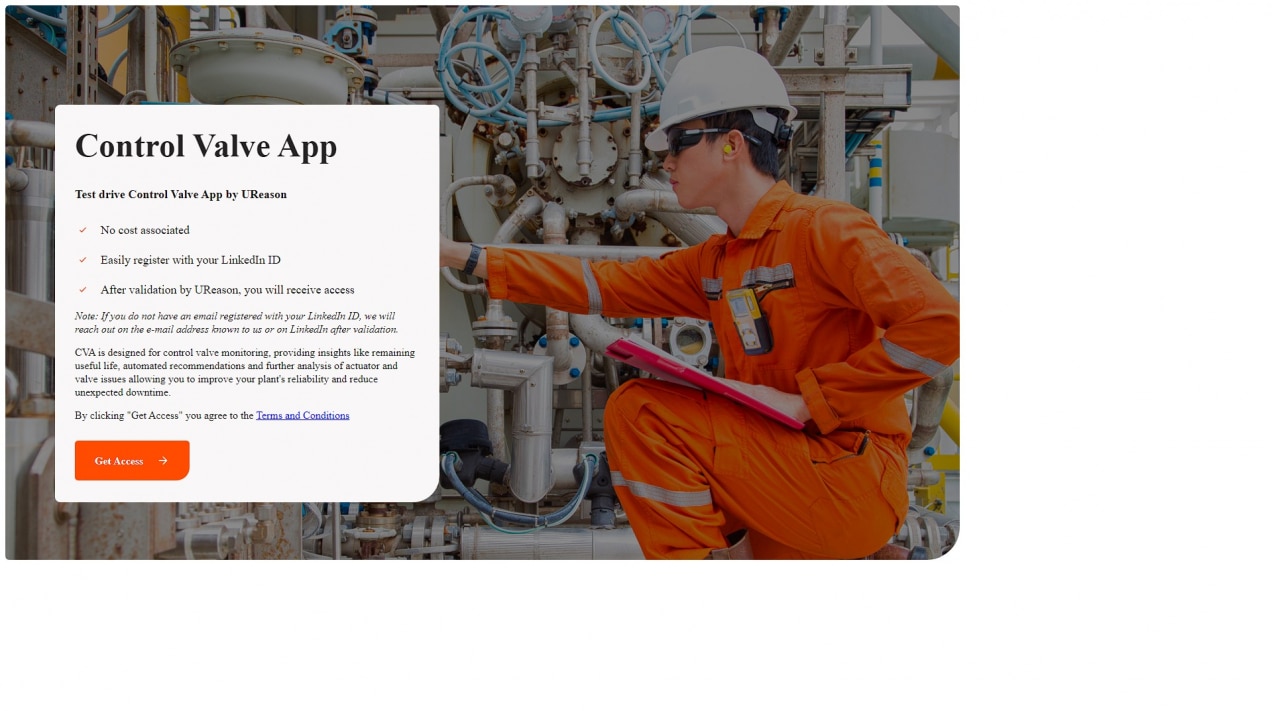
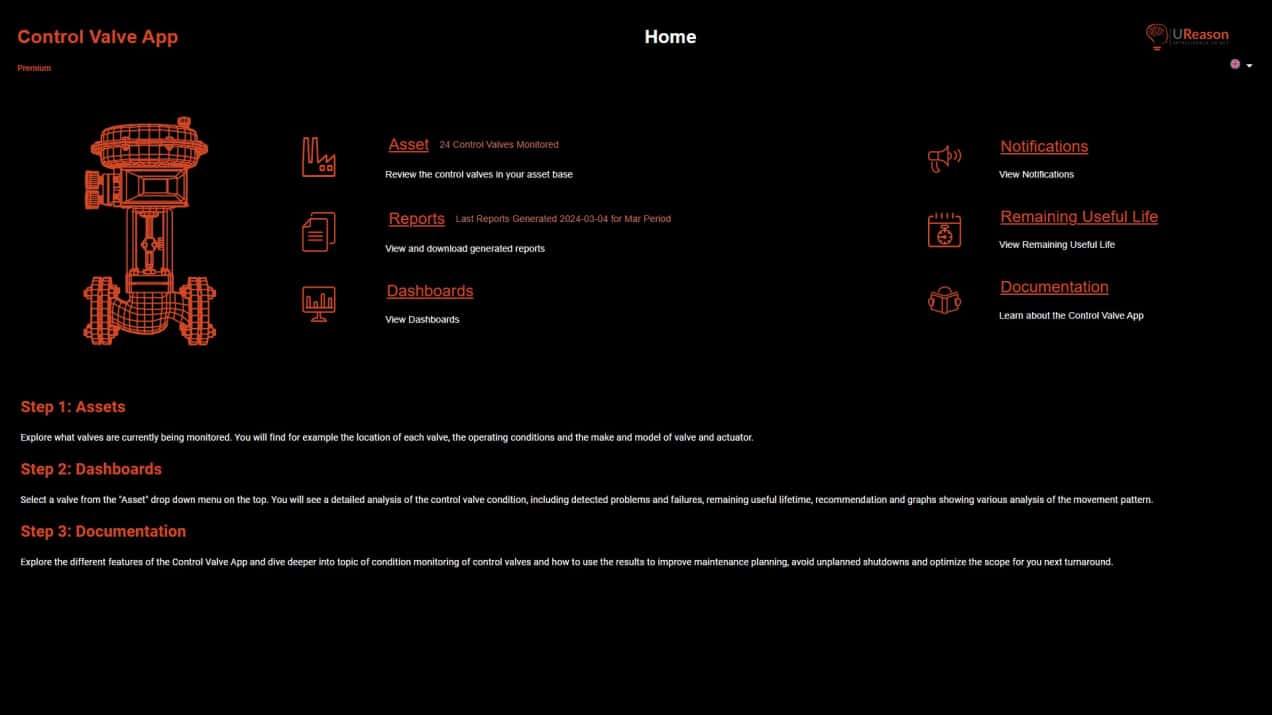
Below are a few of the Control Valve App capabilities further explained. If you want to test drive the Control Valve App register for the Free Demo. Request access with your LinkedIn ID here.
Health Score
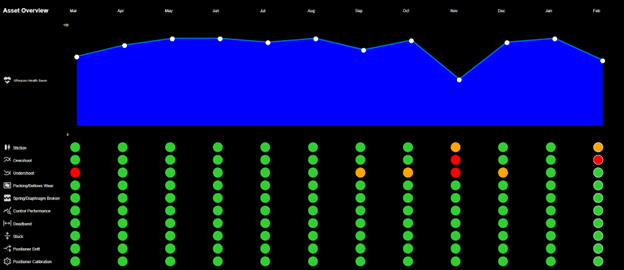
The Control Valve App determines a Health Score, a value between 0 and 100, for all the control valves that are being monitored. The health score is calculated using a variety of parameters related to controller, valve and actuator such as percent of time the control valve is in overshoot, undershoot, is experiencing stiction, etc..
Controller Performance
For all the control valves monitored by the Control Valve App the control performance is diagnosed. It uses several indicators such as over- and undershoot, hunting and dead band.
1. Overshoot
Control overshoot is the extent to which the output of a control system exceeds the desired setpoint or reference value when it is trying to maintain a specific process variable. For example, if a control system is trying to maintain the temperature of a process at a certain level, an overshoot would occur if the temperature temporarily went above the setpoint before the control system can bring it back down to the desired level.
Control overshoot can be caused by several factors, including poor tuning of the control system, high gain or sensitivity, external disturbances or noise, and mechanical wear and tear on the control valve or other components. It can also be caused by a lack of damping or damping that is too low, which can cause oscillations to build up and become more severe over time.
Control overshoot can lead to instability and poor performance in a control system, as it can cause the output to fluctuate or oscillate excessively. To prevent or mitigate control overshoot, it is important to properly tune the control system, including selecting the appropriate control algorithm and gain settings, and to ensure that the control valve and other components are in good working condition. It may also be necessary to add damping or other stabilizing elements to the control system to reduce oscillations and improve its performance.
Overshoot is calculated in the Control Valve App as a % of the valve setpoint and integrated over the observation period. A value under 2% is typically considered normal. A value between 2 and 5 % is considered overshoot and will reported, by the Control Valve App, as a warning. Overshoot more than 5% is high and will reported, by the Control Valve App, as an alert.
2. Undershoot
Control undershoot is the extent to which the output of a control system falls below the desired setpoint or reference value when it is trying to maintain a specific process variable. For example, if a control system is trying to maintain the temperature of a process at a certain level, an undershoot would occur if the temperature temporarily goes below the setpoint before the control system can bring it back up to the desired level. Causes and consequences for undershoot are like overshoot (see above).
Undershoot is calculated as a % of the valve setpoint and integrated over the observation period. A value under 2% is considered normal process. A value between 2 and 5 % is considered undershoot and will be reported, by the Control Valve App, as a warning. Undershoot more than 5% is high and will be reported, by the Control Valve App, as an alert.
3. Hunting
Hunting refers to oscillations or fluctuations in the output of a control system that are caused by the system’s own feedback. It occurs when a control system is trying to maintain a setpoint or reference value, but the output keeps overshooting or undershooting the setpoint, causing the control system to continually make adjustments. This can lead to an unstable and unpredictable control system that is difficult to maintain and optimize. Control loop hunting can be caused by several factors, including poor tuning of the control system, high gain or sensitivity, external disturbances or noise, and mechanical wear and tear on the control valve or other components. It can also be caused by a lack of damping or damping that is too low, which can cause oscillations to build up and become more severe over time.
Learn more about how control can be influenced and how you can use the data you store in your historians and logs to assess control system performance for your control valves by downloading our article Controlling the Control Valve.
Stiction
Stiction in a control valve is a term used in the field of process control and automation. It refers to the static friction or resistance that prevents a valve from moving smoothly and immediately when a control signal is applied. Hence stiction is the combination of the words stick(ing) and friction.
Stiction can be a significant problem in control systems, especially when precise control is required. It is one of the main causes of control oscillations. Stiction can occur for various reasons, including:
- Mechanical Friction: This is the friction between moving parts of the valve, such as the stem and the valve seat. This friction is inevitable but over time, wear and tear, corrosion, or the presence of foreign particles can increase mechanical friction.
- Seal Friction: Valves often have seals or packing materials to prevent leakage. These seals can create additional friction, again inevitable but it can increase especially if they are too tight or dry.
- Lubrication Issues: Insufficient or improper lubrication of moving parts can lead to increased stiction.
Irrespective of the reasons, the presence of stiction can result in sluggish valve response, which can lead to poor control performance in a process control loop (especially with air operated actuators). In extreme cases, stiction can cause oscillations or instability in the control system.
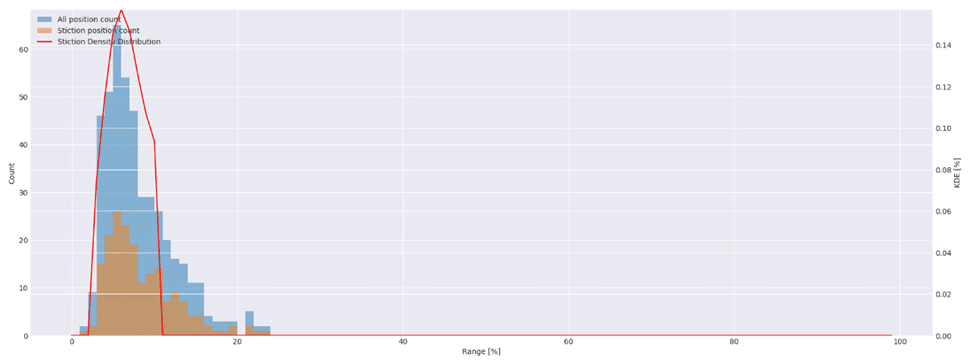
Instead of being confronted with the results of stiction you want to have an early indication of the presence of stiction in your control valve. This is where the Control Valve App comes in. It detects and reports the degree of stiction to its users relative to its operating range:
The Control Valve App does this based on a pattern recognition technique that describes the movement of the valve – e.g. dead band (normal), slip-jump, increasing, steady, decreasing and combinations thereof in a qualitative manner. Using the time-series data of the valve: setpoint and position CO/MV, SP/MV or when position is not available the controlled variable (PV) are used to determine the behaviour and classify the degree of stiction.
The degree of stiction provides not only valuable input for the process/process control engineer allowing them to compensate for stiction but also for maintenance to mitigate.
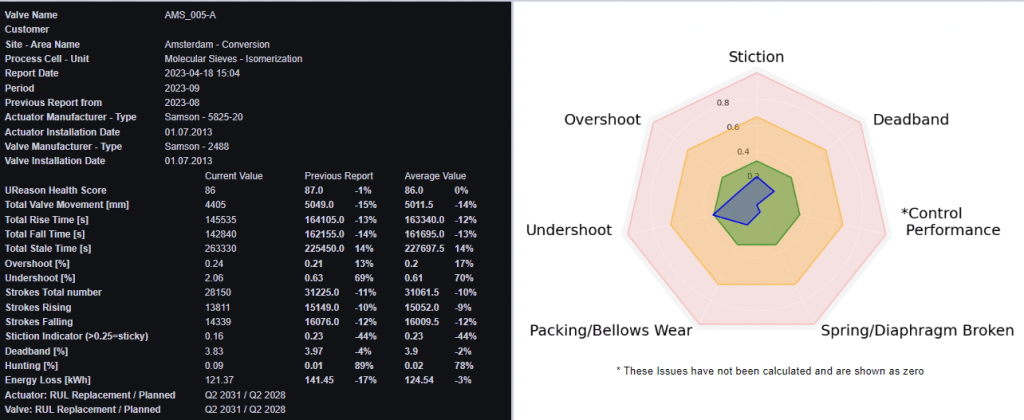
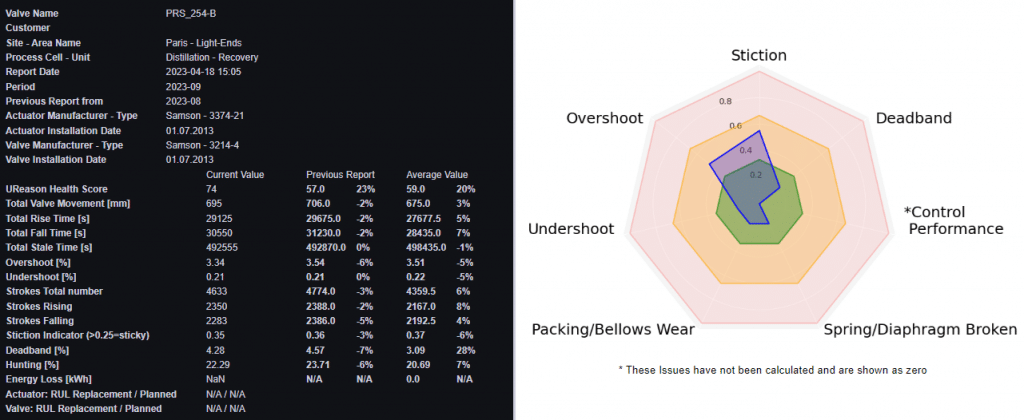
As soon as the degree of stiction goes outward the green centre you should consider lubrication, check the packing torque and/or potentially replace the packing.
Overall, addressing stiction is essential for ensuring the accurate and responsive control of processes in industries such as manufacturing, chemical processing, and oil refining, where control valves play a critical role.
Remaining Useful lifetime
The Remaining Useful Life (RUL) graphs in the Control Valve App show manufacturer’s specifications compared to actual usage of the control valve, operational time and number of strokes as well as the issues that the control valve has been experiencing.

Explore the Control Valve App with Free Demo
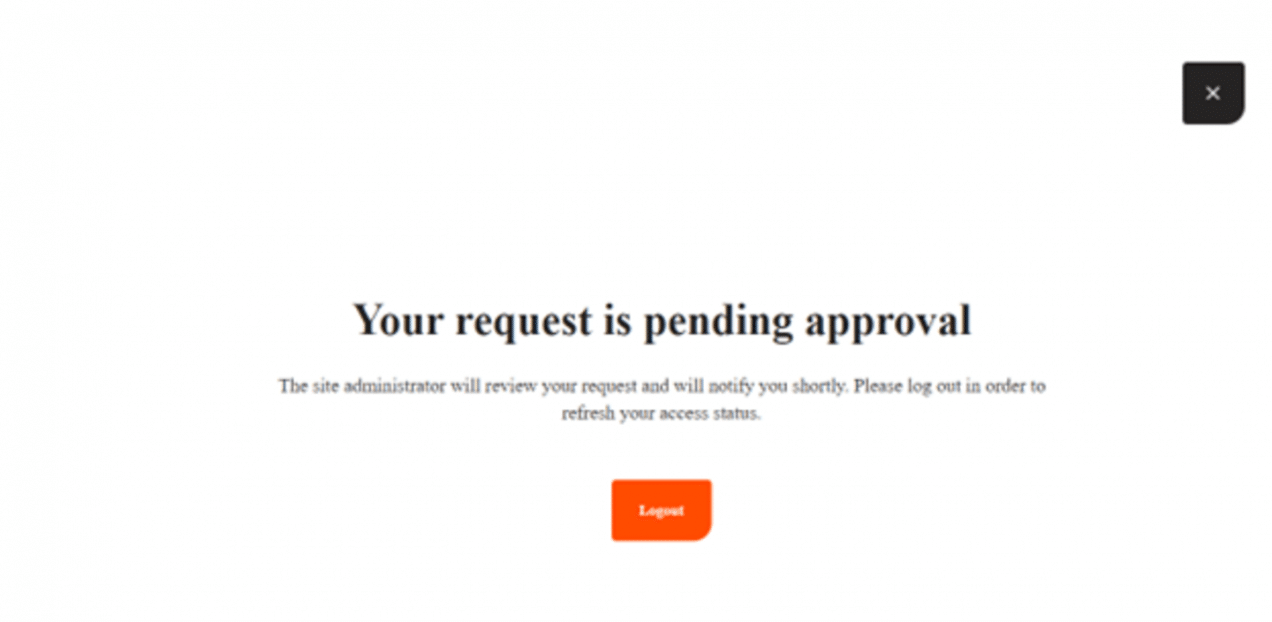
Test drive the Control Valve App by registering for the Free Demo. After registration we validate your request and provide access. The notification of access to the Control Valve App demo site will be sent to the e-mail address that is registered with your LinkedIn account. When no e-mail address is registered we will contact you via LinkedIn or the e-mail address we have on file for you.
