Monitoring control valve health is essential for effective asset performance management in industrial processes. The Control Valve App (CVA), developed by UReason, provides diagnostic insights into valve performance, highlighting specific operational issues such as stiction, overshoot, deadband, and generating comprehensive UReason health scores. While CVA delivers detailed Dashboard, PDF and CSV-based diagnostic reports, technical users frequently require custom visualizations or direct integration into existing analytical platforms.
This article details how technical users can use CVA’s exported data and REST API to create customized dashboards, integrate diagnostic insights directly into plant monitoring systems, and enhance existing analytics models. We provide specific examples, including user-generated visualizations based on CVA data, demonstrating the flexibility and extensibility of CVA outputs.
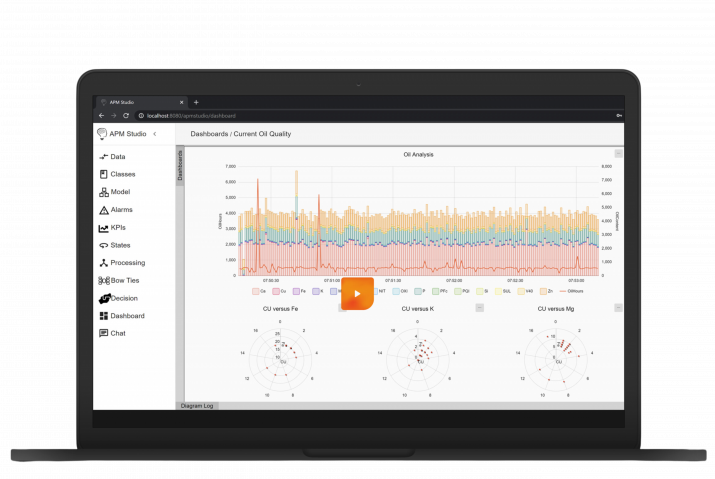
What is the Control Valve App?
The Control Valve App provides automated health diagnostics and performance analysis for control valves, utilizing real-time process and asset data such as valve position, setpoint, and process measurements. Key diagnostic features include:
- Calculation of valve health scores derived from multiple performance metrics.
- Detection and classification of specific issues, including stiction, overshoot, undershoot, packing/bellows wear, deadband, and unstable performance.
- Recommendations for maintenance and corrective actions.
- Remaining Useful Life (RUL) estimations calculated from operational history.
The diagnostic results are accessible through structured reports (Dashboard, PDF, CSV) and via a REST API endpoint for seamless programmatic integration.
Creating Custom Visualizations from CVA Data
Many technical teams have existing analytics environments, ranging from business intelligence (BI) tools such as Power BI, Tableau, and Grafana, to custom Python or R-based data analysis frameworks. CVA supports these platforms by providing raw data exports that can be ingested directly.
Users can export comprehensive valve diagnostic data (e.g., historical health scores, issue detections) as CSV files. This enables further analysis, visualization, and integration into existing analytic and predictive frameworks.
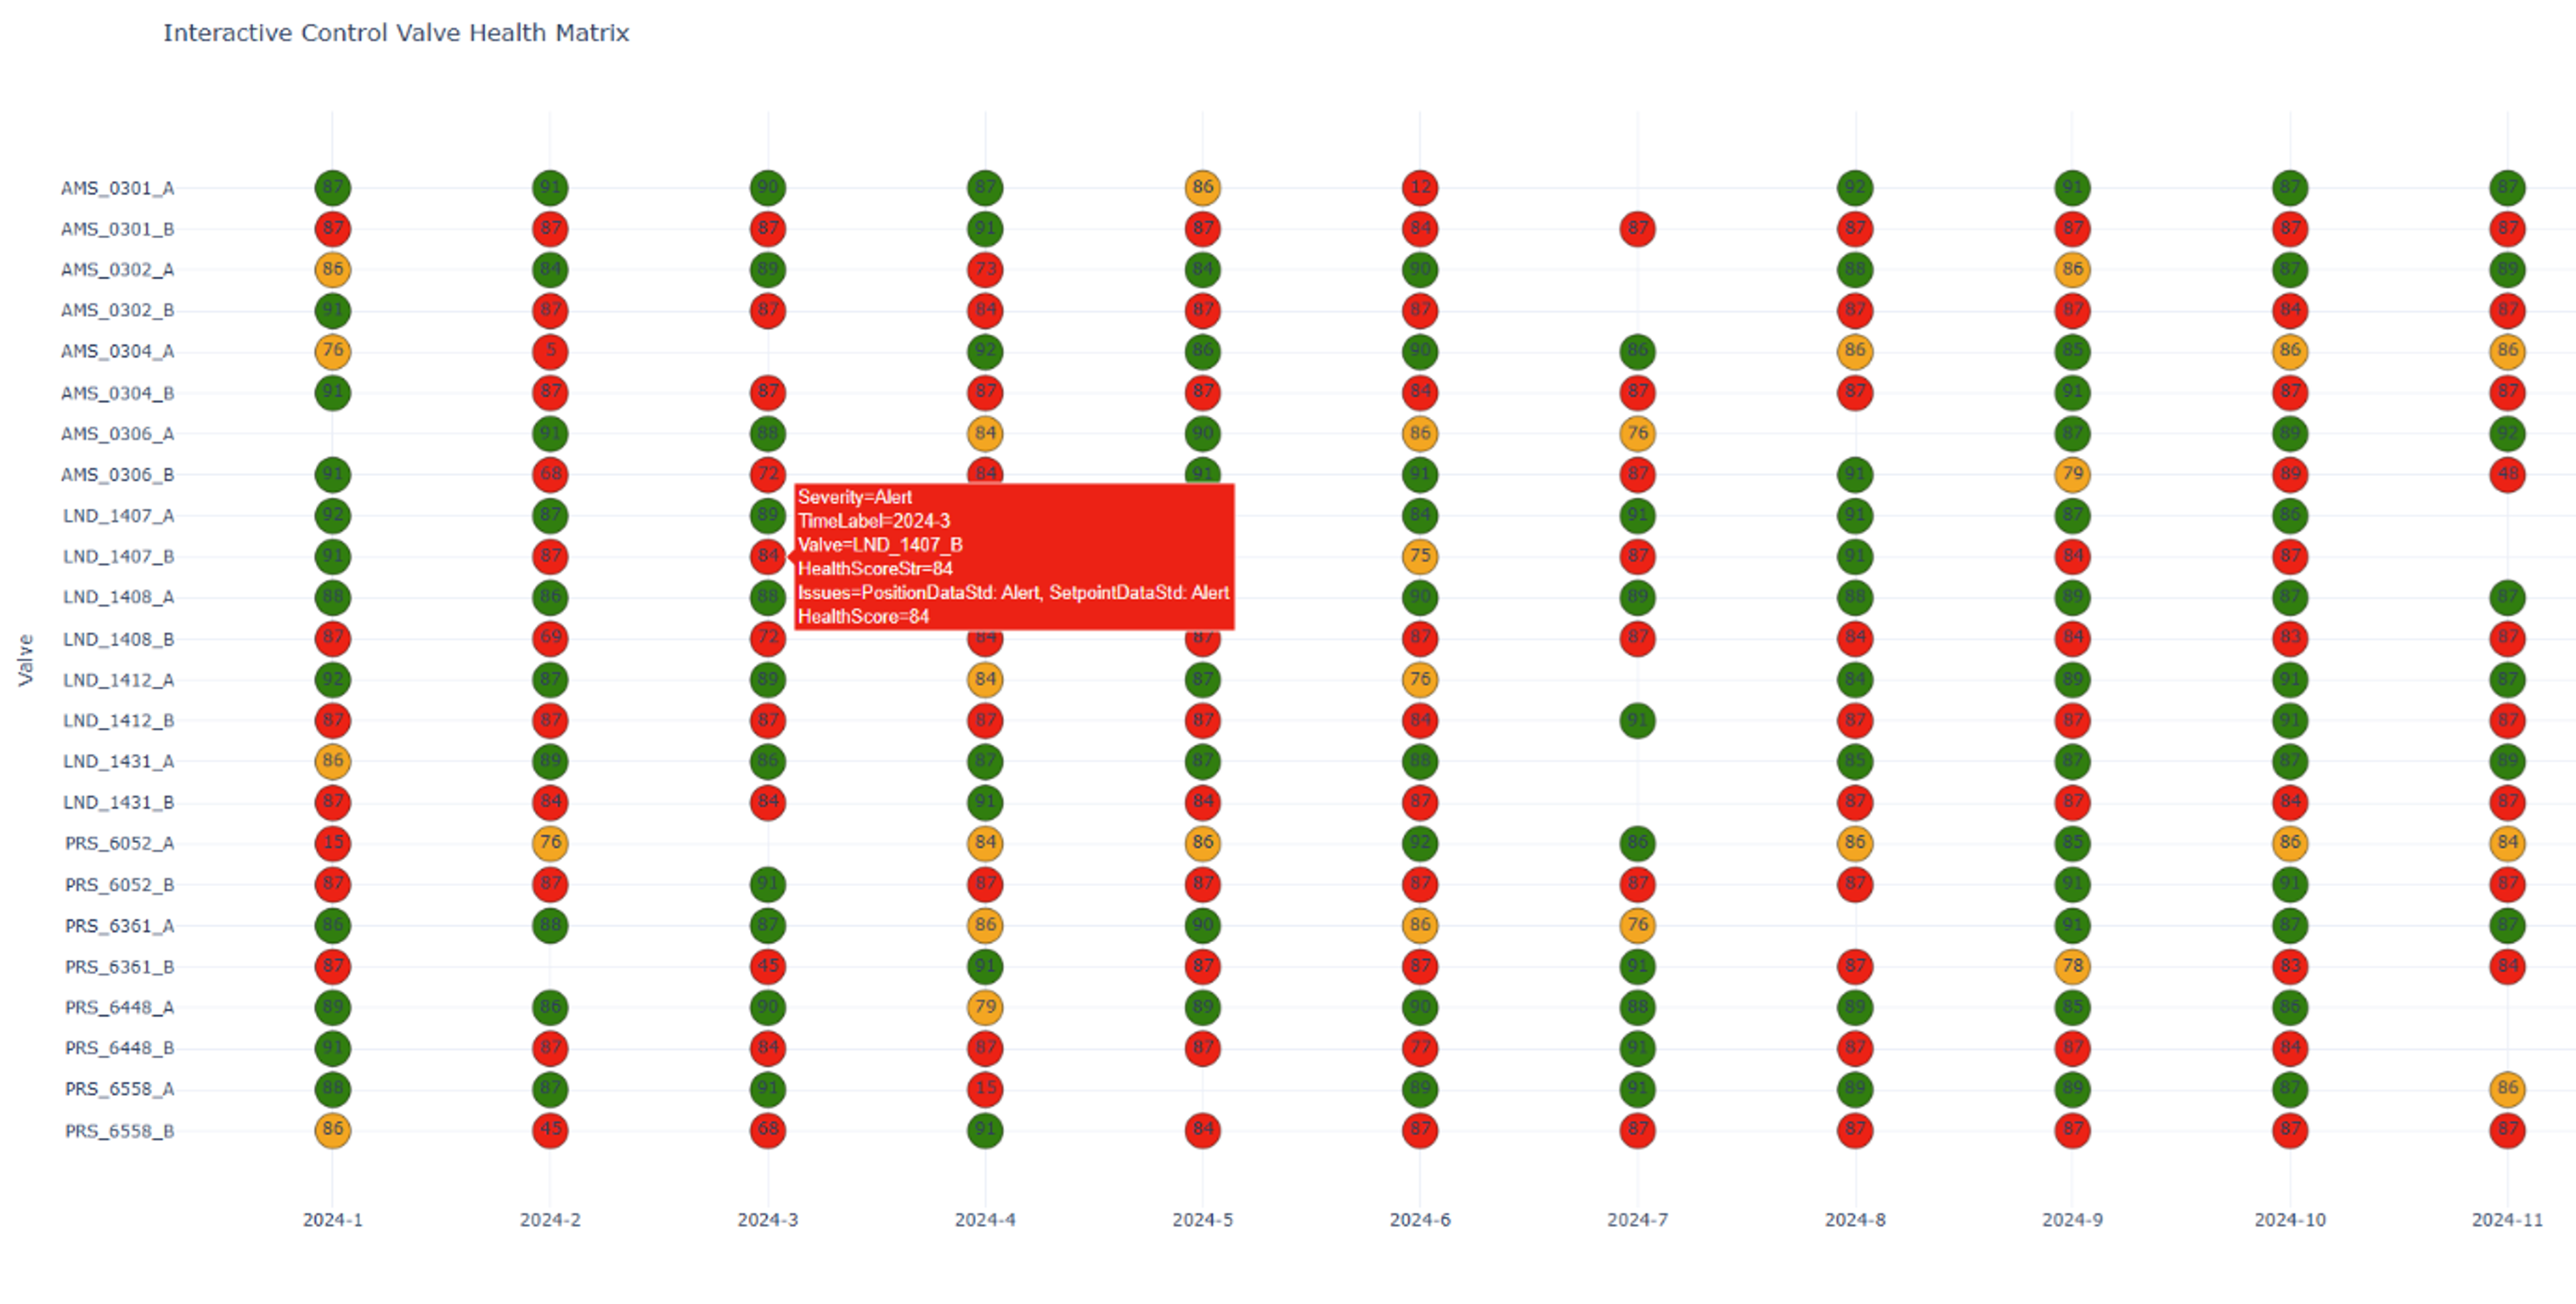
Example: Interactive Control Valve Health Matrix Visualization
Consider a user-generated example: an interactive “Control Valve Health Matrix” visualization built with historical CSV exports from CVA:
- Rows represent individual control valves.
- Columns represent specific monitoring periods (e.g., monthly intervals).
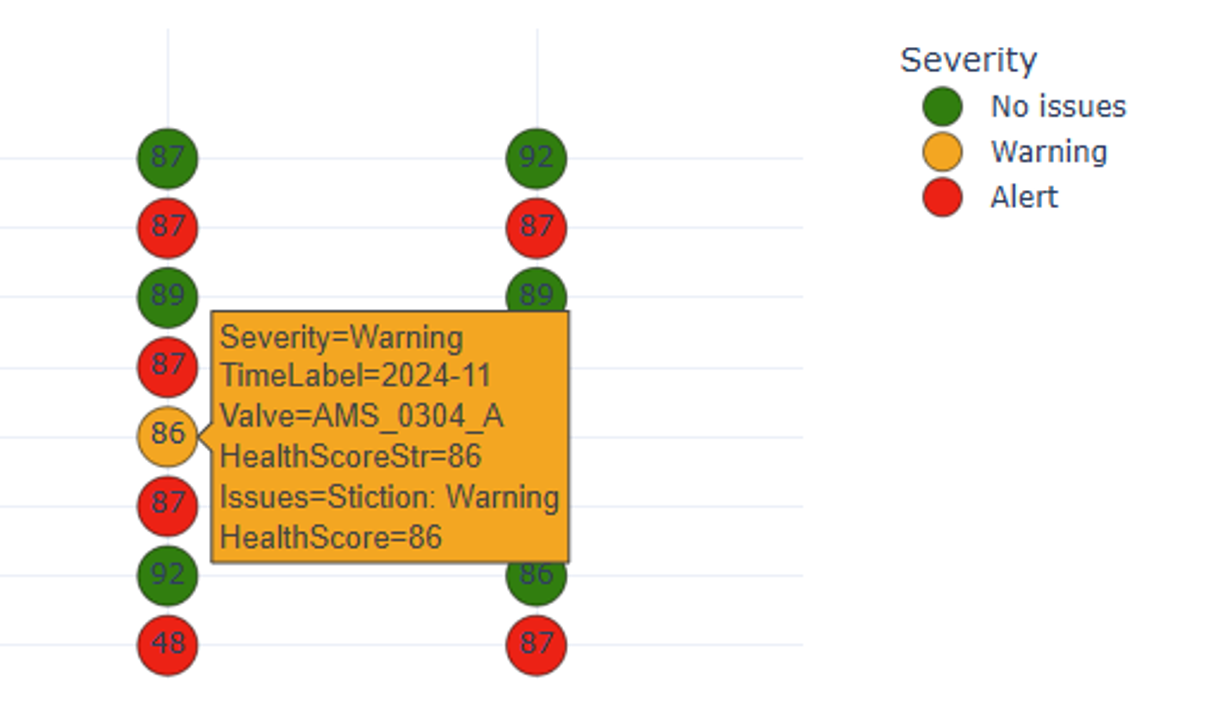
- Color coding indicates health statuses clearly: green (healthy), yellow (warning), red (alert).
- Numeric values within cells directly represent CVA-derived health scores.
This visualization allows reliability engineers and maintenance teams to immediately pinpoint degrading valves, track “bad actors,” and identify systematic issues such as recurring controller tuning problems or mechanical degradation patterns.
Integrating CVA Insights into Existing Analytics Systems
The CVA REST API provides secure programmatic access (via standard RESTful protocols and token-based authentication) to retrieve both real-time and historical valve diagnostic data. Common integration scenarios include:
- Merging valve diagnostic data with broader asset analytics (e.g., pump, motor diagnostics).
- Automating alerts based on CVA-generated performance indicators.
- Incorporating valve health data into existing predictive maintenance workflows.
For example, organizations might regularly query the CVA REST API weekly to update their condition-based maintenance (CBM) platforms, aligning valve health diagnostics with broader asset management decisions and dynamically adjusting maintenance plans.
REST API Technical Details:
- RESTful endpoints (GET methods for diagnostics retrieval).
- JSON-formatted responses containing structured diagnostics (health scores, detected issues, recommended actions).
- Token-based authentication for secure API interactions.
Conclusion
The Control Valve App provides robust diagnostics and actionable insights for valve maintenance. Yet its real power emerges when technical users leverage its CSV exports and REST API endpoints for custom analytics:
- Creating tailored visualizations that precisely fit operational needs.
- Integrating directly with existing dashboards and plant monitoring platforms.
- Enhancing predictive maintenance practices and asset reliability initiatives.
This adaptability makes CVA an invaluable data source for comprehensive and proactive asset management strategies.
For technical details on REST API implementation or CSV data structures for custom analytics, please contact UReason or consult the official CVA documentation.
Try the Control Valve App Interactive Demo
See how real-time diagnostics, predictive insights, and automated health scoring can transform valve maintenance. Explore the interactive demo to navigate key features, detect common valve issues, and discover how CVA enhances reliability and efficiency.