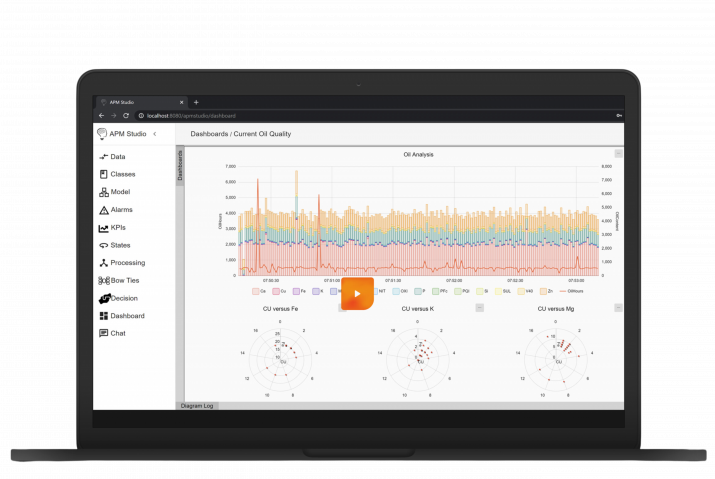
Key Performance Indicators will allow you to continuously monitor asset performance and can be configured to automatically alert users if operating conditions become outside acceptable values.
For instance, it may be useful to create a KPI to calculate and monitor the power consumption of a piece of equipment and alert the user if the value goes above an acceptable threshold.
In this tutorial you will learn how to:
- Create a KPI
- Link it to a Class
- Add thresholds
- Bring KPIs live over multiple assets easily
Benefits of using KPIs in APM Studio
Using KPIs in APM Studio helps you track asset performance and detect potential issues early. You can use simple rules or develop advanced mathematical and physics-based formulas to calculate KPIs, making them adaptable to different types of operations. By setting automatic alerts, operators and engineers are quickly notified when a KPI goes out of range, allowing them to take immediate action and prevent unplanned downtime. Linking KPIs to Classes also saves time by letting you apply the same monitoring rules across many assets at once. This approach ensures consistent tracking, efficient scaling, and a clear path to continuous improvement in your operations.