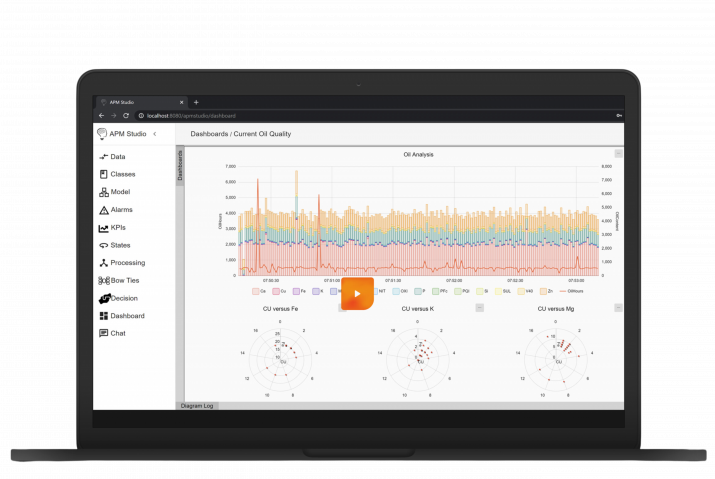
In addition to the asset data you collect from your instruments and telemetry there is another set of data that is of importance namely the service data that you administer and store in your Enterprise Asset Management or Computerized Maintenance Management Systems.
The combination of asset data and service delivery data, allows you to further optimize the maintenance delivery in the field.
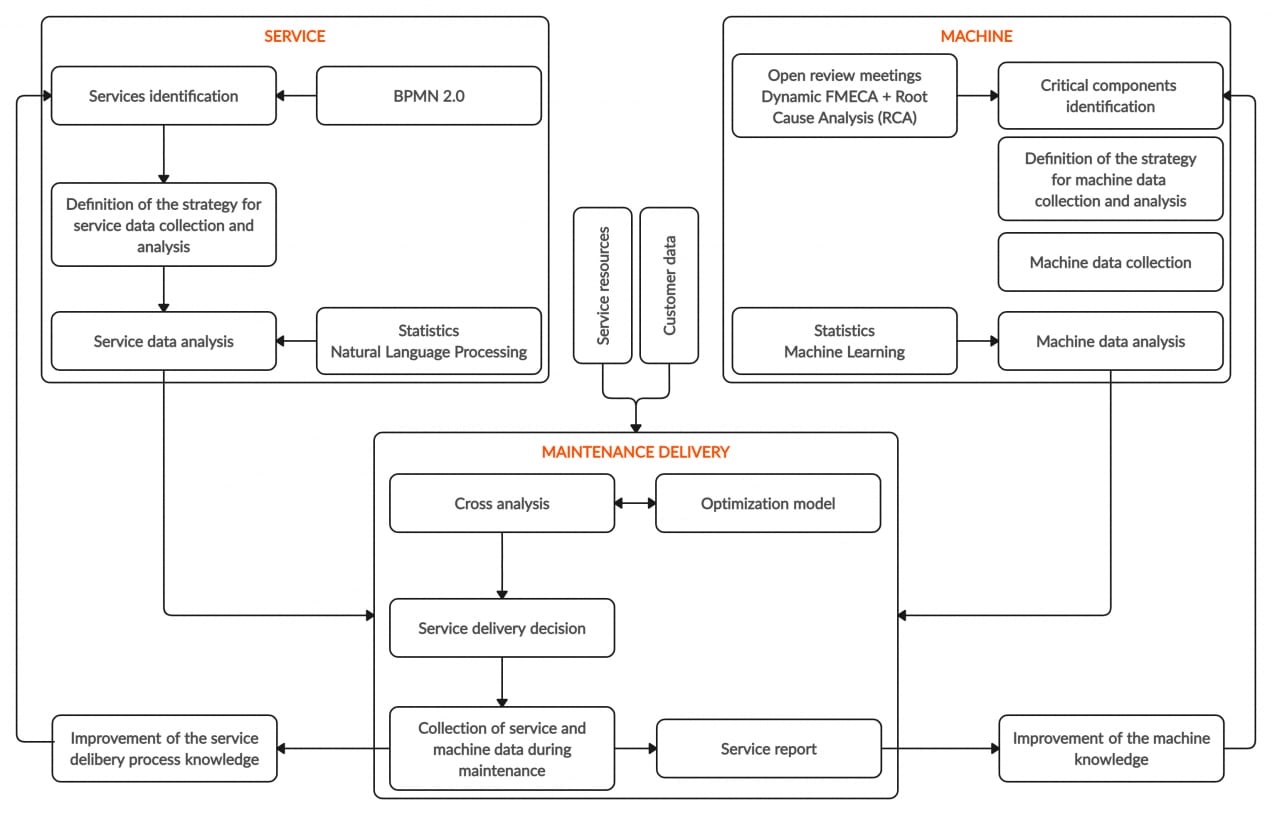
A recent publication that represents this combination quite well is the D3M framework – the Data-based Decision-making process for maintenance Delivery (see Journal of Manufacturing Technology Management ISSN: 1741-038X).
In the D3M model, on the right-hand side, we see the machine/asset data and part of the processes required to determine the service delivery and on the left-hand side the service data and processes. These come together at the service delivery where to be honest the data collection of the actual service delivery still needs a lot of discipline and structure to make it more useful. In this area the ISO 14224 is quite a good guidance for the collection and exchange of reliability and maintenance data for equipment.
Check Out More of Our Articles
If you enjoyed reading this article make sure to check out more articles on our website!