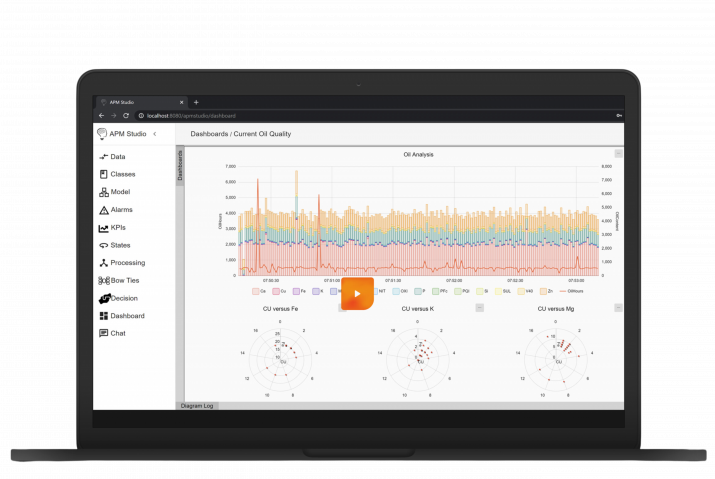
Providing data to the LLM model depends on the use-case, the use cases we worked range from simple interactions like “find me X”, “explain me Y” to more advanced use-cases evaluating performance of a group of control valves given time-series data. Our customers have large volumes of text resources (manuals, maintenance activities, inspection reports et cetera) and time-series data from control valves. In addition, we generate quite some additional time-series in the Control Valve App (CVA). The CVA already generates Remaining Useful Lifetime indications and recommendations. Extending this with LLM support would be a great addition providing additional advisories/recommendations and predictions.
Evaluating search queries for missing information
The main strength of LLMs is to understand human text in a provided context. By providing the required information to LLM along with a user prompt, the model can detect the information that is missing, and return a query requesting it.
User prompt 1: “I am interested in finding data for Valve 2345 from the XYZ Solutions database located on plant SG-52.”
- Output: “Apologies for the inquiry; however, we require additional information to proceed. Please provide the specific time period needed for data analysis to proceed with your request regarding Valve 2345 from the XYZ Solutions database at plant SG-52. Thank you for your understanding.”
User prompt 2: “I am interested in finding data for Valve 2467.”
- Output: “I apologize for any inconvenience, but in order to assist you with your data query, I will need additional information such as the specific time period, relevant database, and the location of Valve 2467. Please provide these details so I can better serve your needs. Thank you.”
As an extension to these examples, the conversation can be further continued with the answer. For example, for user prompt 1:
User prompt 1-follow up: “The time period is January to March 2024.”
- Output 1: “The provided information appears to be complete with Valve ID (2345), time period (January to March 2024), database (Aker Solutions), and location (plant SG-52). No further data seems to be required. If any other details are needed, please let us know.”
- Output 2: “Based on your provided information, it seems you have provided sufficient details including Valve ID (2345), time period (January to March 2024), database (Aker Solutions), and location (plant SG-52). Thank you for providing complete details. If you need any further assistance, please feel free to ask.”
- Output 3: “The provided information appears to be complete with Valve ID, time period, database, and location. No additional details are needed at this time. Thank you for your input.”
Note: The query to the model for these particular examples consisted of “find if there is information missing given a list of required details”. The model was not asked to further refine the prompt into a database query. This so called prompt engineering is a bit of an art and science.
Computation Time: For all of these prompts, running on a Nvidia A6000, a good, but not top of the line GPU, Mistral 8x7b managed to answer in ~1 second.
Searching for valves in a collection
Though not a known strength of LLMs, it was found possible to use LLMs as a means of searching a list and perform additional tasks while doing so.
Data: The prompt consisted for valve metadata/data for a list of valves. In this structured list, the metadata consisted of:
- ID
- Medium
- ValveSize
- ValveType
- ValveManufacturer
- ValveInstallationDate
- ActuatorType
- ActuatorManufacturer
- ActuatorInstallationDate
The data consisted of monthly data with:
- HealthClass: A letter or number indicating aggregated health provided by the Control Valve App (CVA)
- IssuesAlarm: List of alarms raised in this period by the CVA
- IssuesWarning: List of warnings raised in this period by the CVA
- ChangeInHealth: Change in health score from the previous month
Prompt: The prompt consisted of testing different variations of “Find valves which have manufacturer X, of type Y, in medium Z, and provide a list of these valves along with an explanation of the valve performance over the data, and a placeholder to the worst performing month.”
The core idea of the prompt was to allow for specific information filtering from a database, whilst also providing an overview of valve health and a placeholder for visual information to later be added.
- Output: “Given such a list, out of 10-40 valves, most types of LLMs correctly found the items in the list. However, LLaMa was found to be less consistent, and frequently overlook several valves which fit the search criteria. An example of the explanation provided by the LLM:
- “ID”: “VF-1298”,
- “Explanation”: “The health of VF-1298 has been mostly stable over time with slight variations in health status from month to month. However, in $VF-1298_Month3$ it had its worst health status of class ‘C’. Recently in $VF-1298_Month7$ it had another drop in health status to class ‘C’, indicating a possible downward trend in performance.”
Overall, ChatGPT and Mistral performed admirably well in this task, allowing for LLMs to be used as an interactive search/query tool for overview many valves. As an extension to this prompting system, the query can be transformed with some simple processing rules into a usable database query, allowing for multiple sources of redundancy when requiring absolute certainty.
Computation Time: 4-8 seconds for a list of 10 valves, 30 seconds for 20 valves, with the computation time increasing depending on the length of the list. If combined with smart database querying, the computation time is fixed to a short period, with the database query being substitute instead of manual LLM search.
Evaluating valve performance using Time-Series
Evaluating valve performance as described in “Temporal Data Meets LLM – Explainable Financial Time Series Forecasting” by Xinli Yu et al., shows that it is possible to use LLMs to successfully make financial predictions.
Making predictions is of interest to the users of the Control Valve App as it will allow them to request the LLM to provide and explain expected health trend and issues.
Prompt: “Describe in detail the valve health score trend over time for Valve A. Explain your reasoning.
The trend is represented by bins, where each bin corresponds to the monthly health score as a percentage, along with any issues that are detected in that month. A drop up to 10% is considered acceptable as long as it recovers within the subsequent months.
The Valve A bins are: “91%”, “89%”, “90%”, “87%”, “90%”. “89%”, “92%”.”
- Output: “Based on the provided data for Valve A’s health scores and issues detected each month, we can observe some fluctuations but no significant deterioration or consistent downward trend. Here’s an interpretation of these scores and my reasoning:
- 1. “91%”: This represents an above-average health score. The valve starts off on a strong note which shows it’s properly maintained and functioning efficiently.
- 2. “89%”: Although there’s been a slight drop from the previous month, it’s still within an acceptable range and might be due to minor issues or maintenance activities that temporarily impact performance.
- 3. “90%”: The valve’s performance recovers quickly and goes back up close to its initial value, indicating that any issues were resolved effectively.
- 4. “87%”: Another slight drop occurs here, suggesting that some issues might be recurring or that new problems have emerged. However, it’s still within an acceptable range and could be related to seasonal factors or intermittent events.
- 5. “90%”: Similar to the second month’s performance, there’s an improvement from the previous month’s score, showing that any issues have been addressed promptly or have resolved themselves.
- 6. “89%”: The valve’s performance dips again but remains close to its average score. This might suggest that some issues persist but aren’t significantly impacting overall performance or could be due to routine maintenance activities.
- 7. “92%”: Finally, there’s an improvement from previous months’ scores which indicates that any issues identified have been addressed or have resolved themselves without further impact on performance.
Overall, it seems like there’s been some fluctuation in Valve A’s health scores with minor drops followed by recoveries within subsequent months. This could be due to various factors such as seasonal variations or intermittent issues that can be resolved quickly without causing long-term performance deterioration. However, it would be beneficial to conduct further analysis on these fluctuations and address any recurring issues to ensure long-term stability and optimal performance of the valve.”
Overall, Mistral and ChatGPT worked very well towards this problem. In particular, Mistral, with the A6000 GPU, was able to generate such an analysis in ~10-15 seconds, consistently over multiple attempts. LLaMa had some difficulties with this use, frequently getting numbers wrong or misunderstanding the relationship between numbers. Notably, it mistook 89% -> 92% as a decrease rather than an increase.
However, the result above provided by Mistral is clear and correct. The downside of using a singular valve however is that the frame of reference is limited to %. While this works, in cases where subtle valve performance changes are important, it is frequently easier to compare the valve of interest with example behaviours.
Comparing health scores between valves
This example describes the same valve as the previous example, with example valves being provided, to obtain a better frame of reference and hence providing a comparison of behaviour and trend to the user.
[This section is omitted from the blog, download the article to get full access]
Directly providing CVA valve information
The Control Valve App ingests position and setpoint information, and extracts more information, such as drift, deadband, positioner issues, etc. In previous examples, only the health score is provided, an aggregate of all the issues in the valve. Though this is useful for quick glances at a valve, it ignores the complexities underneath the surface. We aimed to test the LLMs ability to ingest any form of data, and understand the format, to analyse CVA data further.
[This section is omitted from the blog, download the article to get full access]
Output formatting (JSON)
LLM are trained to write in different styles and for different genres, including programming-speak. In all our experiments, we successfully obtained a usable JSON output from all LLMs, allowing the results to be used with various application process with ease. For example, given the search query, the actual output consisted of:
```json
{
    "Query": "Find the Valves with Valve Manufacturer: \"SAMSON\".",
    "List": [
        {
            "ID": "VF-1295",
            "Explanation": "The overall health of this Samson Globe valve has been mostly stable and in class \"A\". However, it has shown signs of degradation in month 5 where it was downgraded to class \"B\" due to an issue of increased overshoot and has experienced fluctuating health in other months as well.",
            "Placeholder": "$VF-1295_Month5$"
       },
        ........ OTHER ITEMS ........
]
}
```
Instructions and PDF reading
As observed throughout all our experiments, LLMs are very capable of summarizing information. This applies equally to GPT, LLaMa and Mistral. Using a popular framework called LangChain, we successfully allowed our local LLMs to provide answers given a PDF. In the case of the CVA, we connected Mistal or LLaMa to valve and actuator manufacturer technical specification documents, allowing the model to provide answers contextualized by the manufacturer’s documentation. This technique allows the model to read both text and tabular information.
[This section is omitted from the blog, download the article to get full access]
Next in the Series: Large Language Models – The Future of Generative AI in APM
Get Full Access of UReason LLM Report Q1/2024
Fill in the form to get full access of our report, including exclusive sections and unreleased chapters


