APM Studio’s integrated dashboarding capabilities let you monitor, analyse, and display both real-time and historical data within a highly configurable, web-based environment. At the same time, our open API design ensures you can pull data into your own preferred analytics and visualization platforms whenever necessary.
 Core Visualization Features
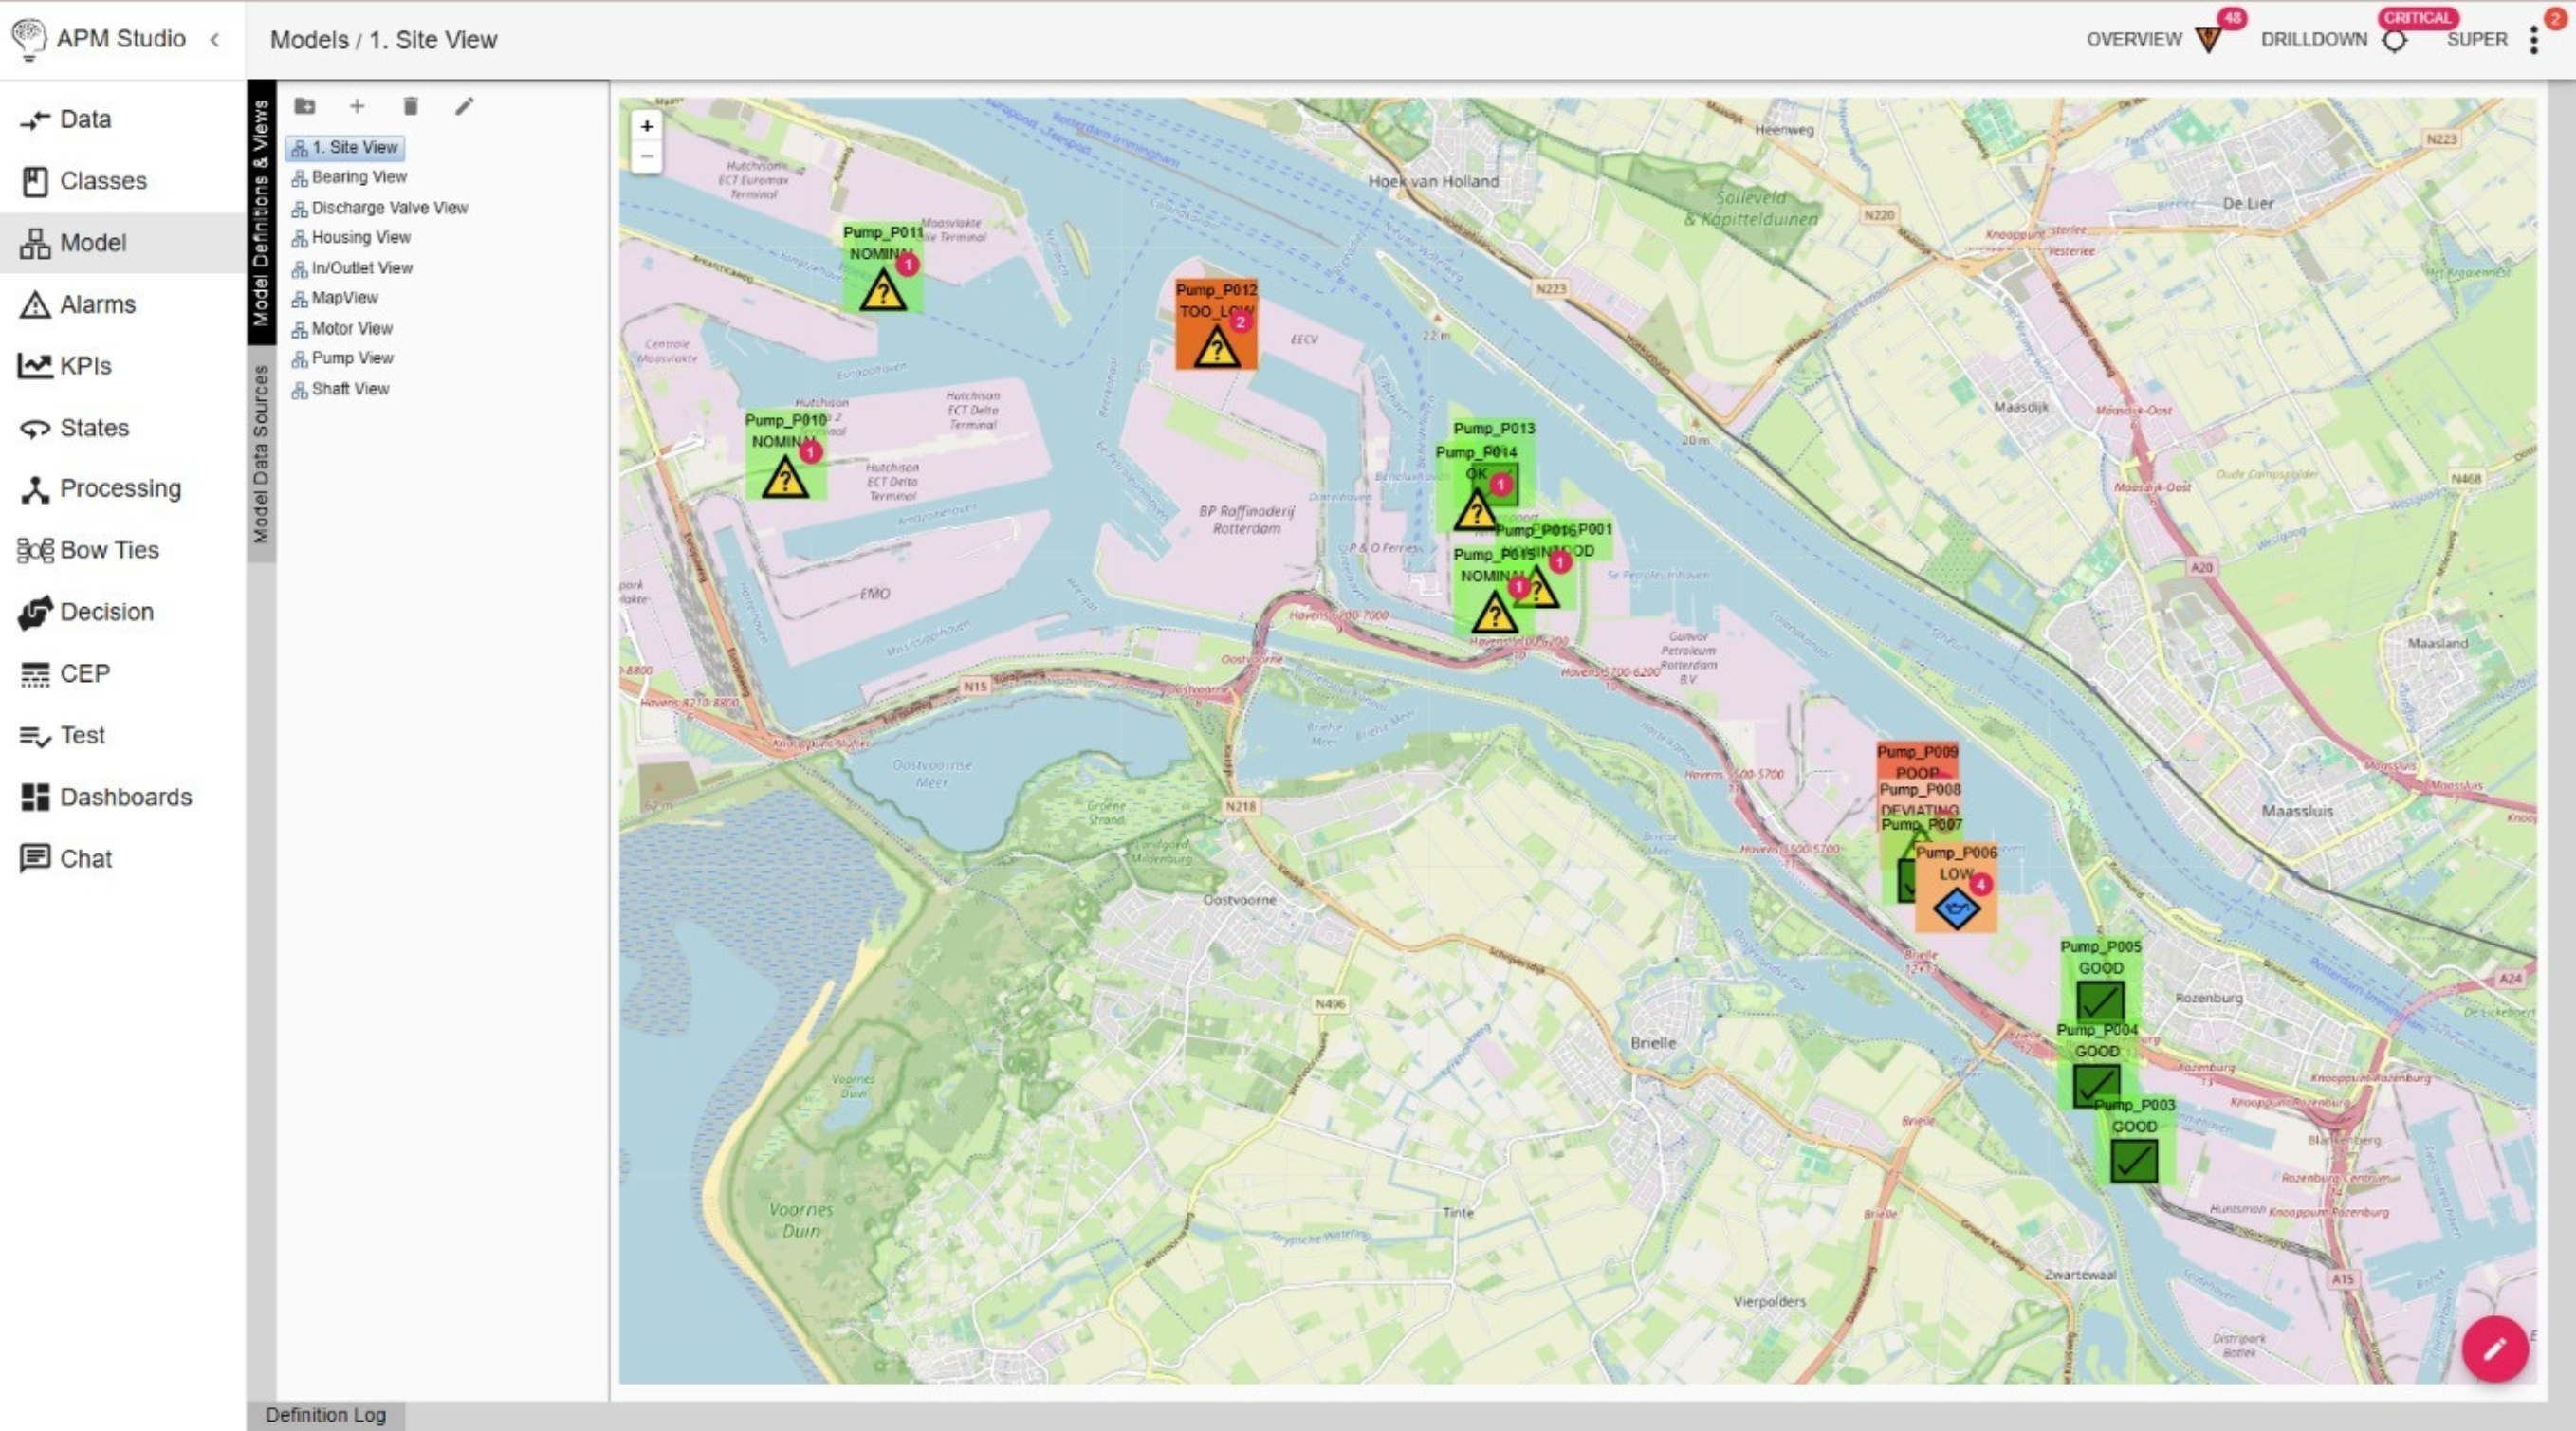
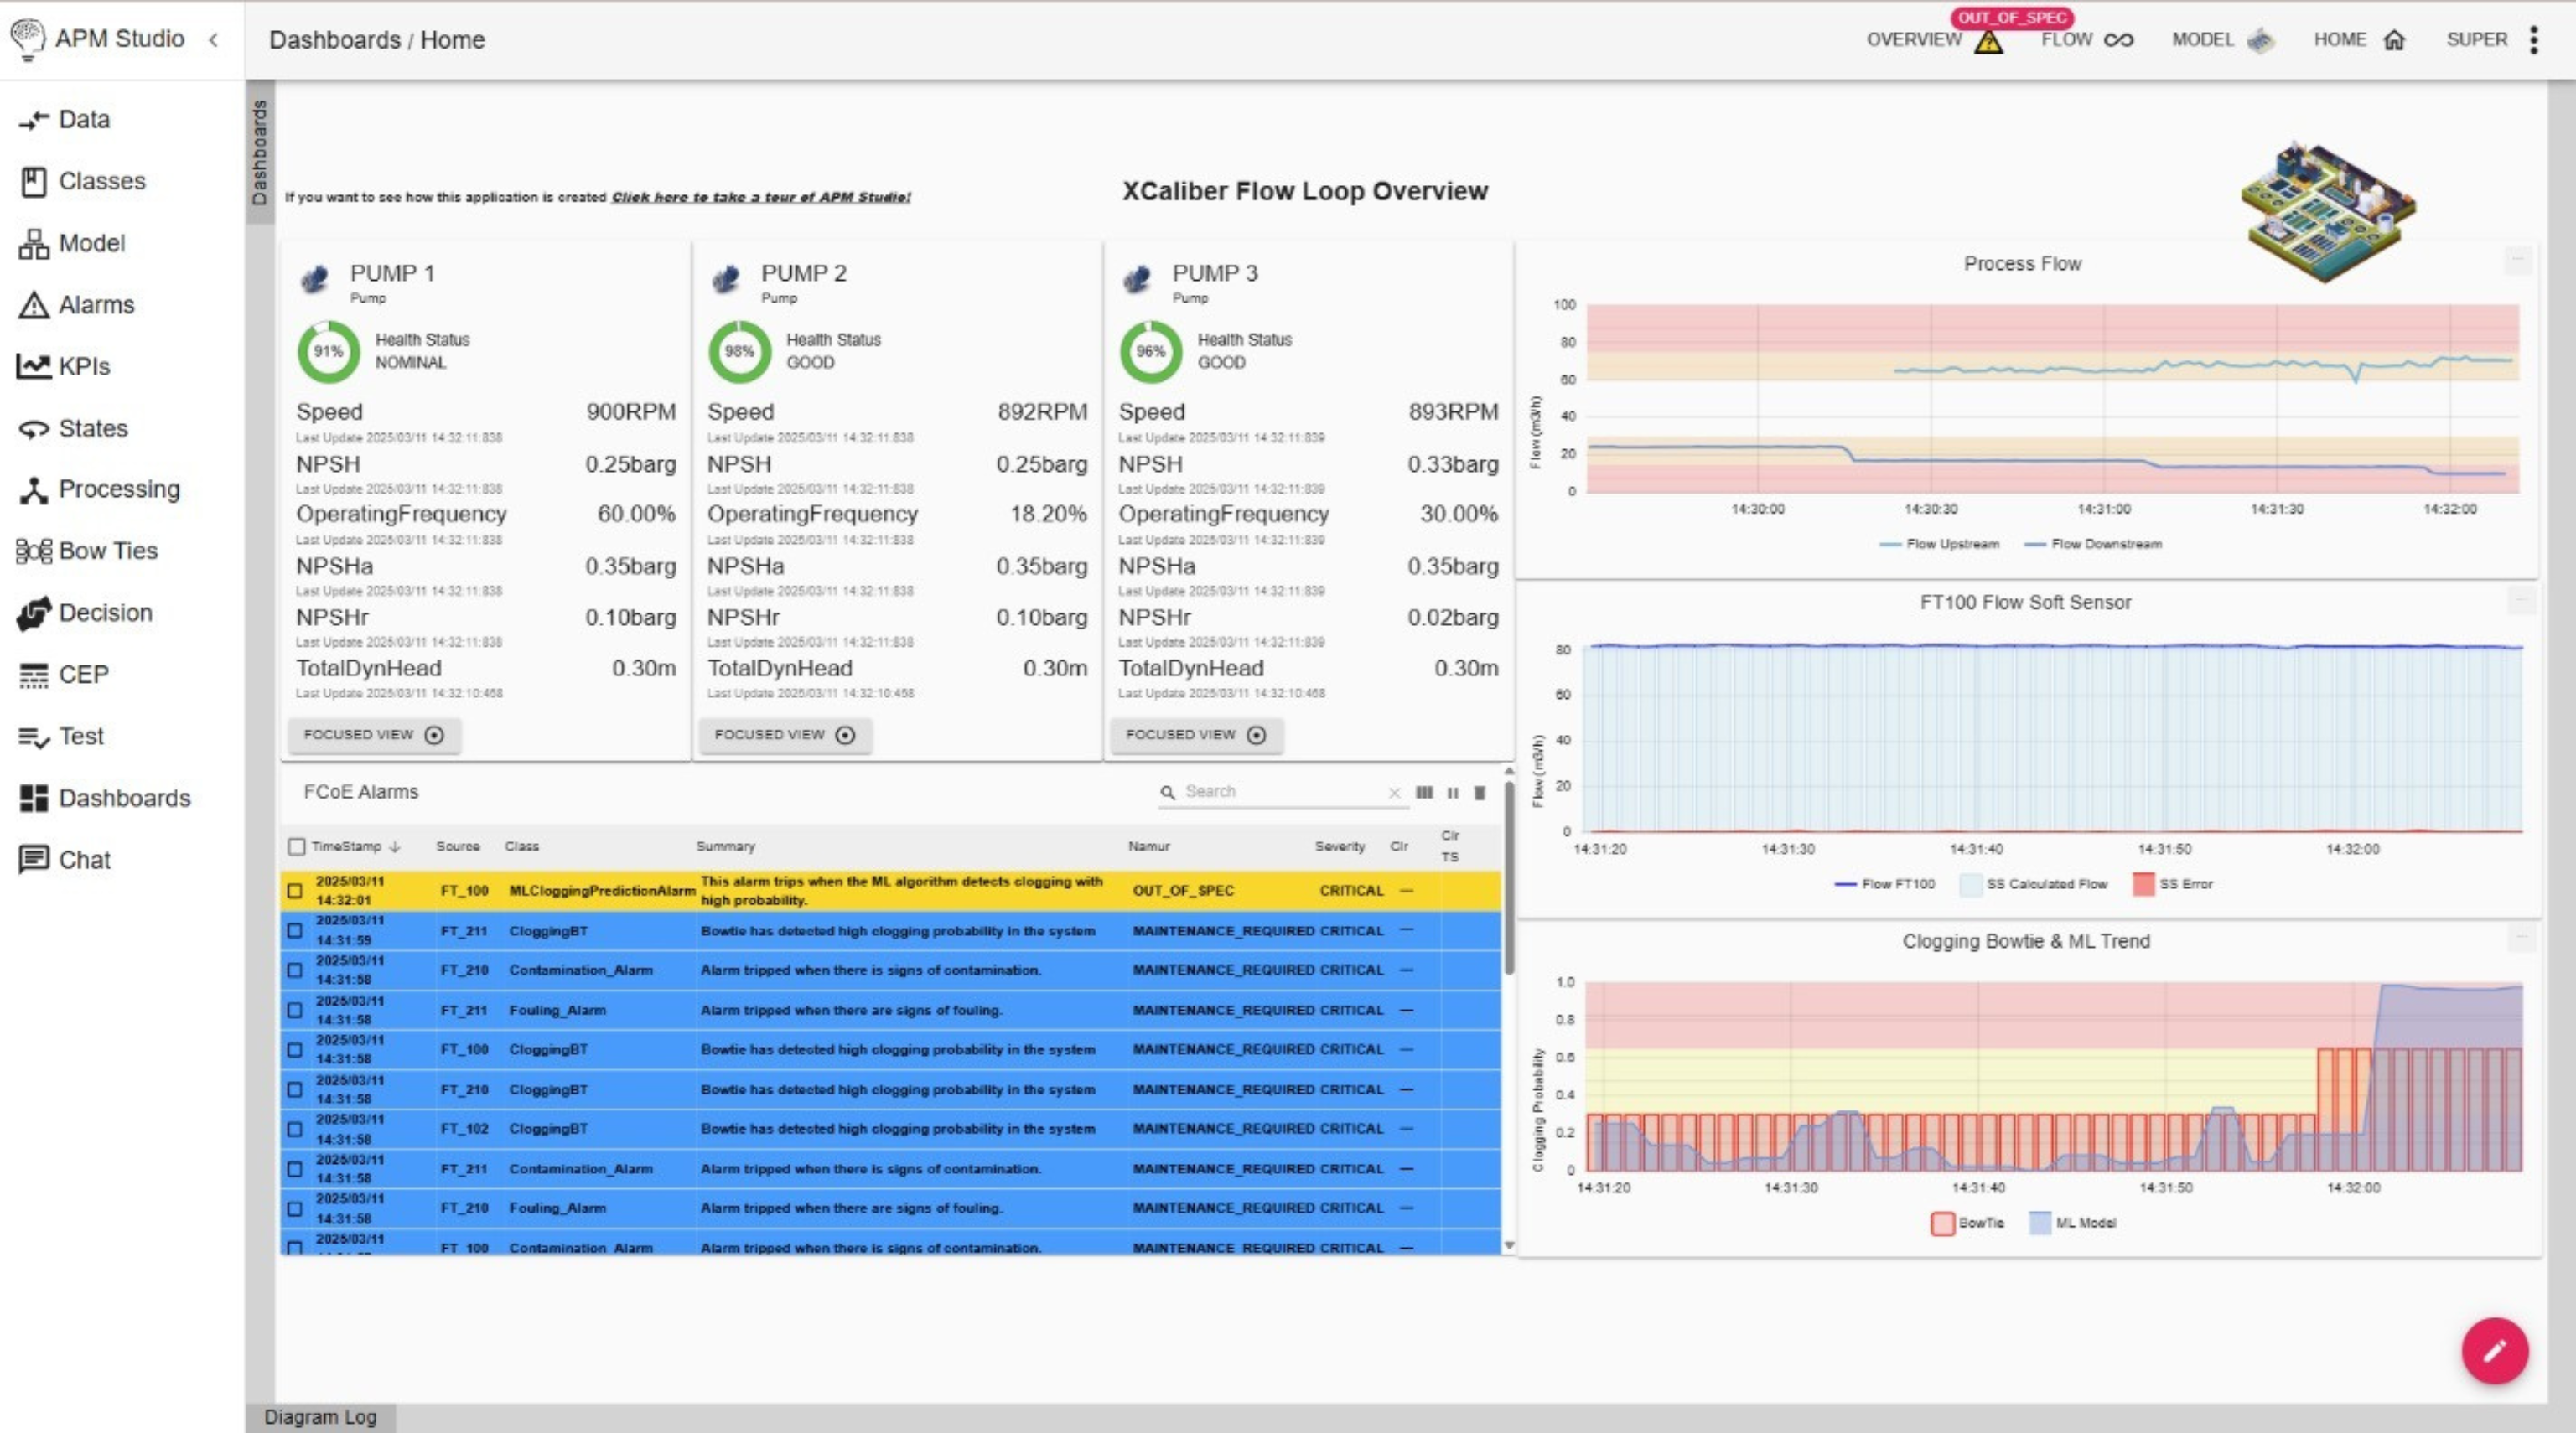
- Asset Cards
Quickly see equipment health, KPI statuses, and critical property values in a single glance. Asset Cards are particularly useful for rapidly identifying anomalies or assets that need immediate attention. - Time Series & Event Overlay
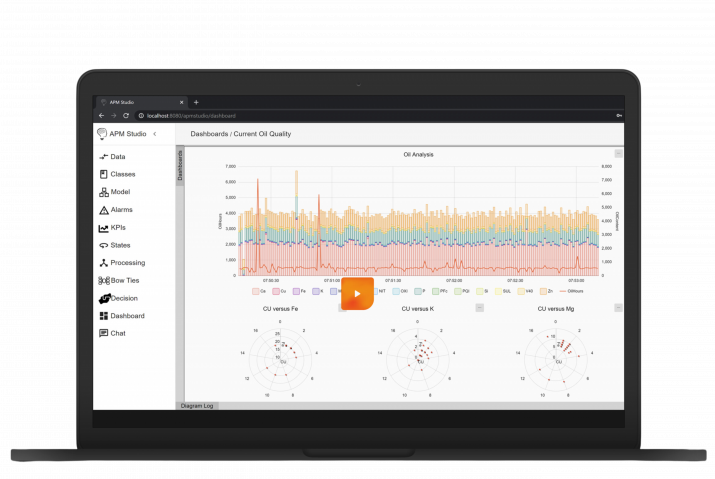
Combine live sensor data and historical readings with event markers (e.g., alarms, maintenance activities) on the same chart. This makes it easier to connect operational events to underlying trends. - Rich Charting Options
Choose from Pie, Radar, XY (Scatter), Gauge, and other chart types to tailor your dashboard to diverse data sets—no extra plugins required. - Real-Time Updates
Dashboards auto-refresh with the latest readings, ensuring you have the most current data for critical decision-making. - PDF Reporting
Generate professional, automated PDF reports of your dashboards and charts. These can be scheduled or triggered by specific events, making it easy to share insights with stakeholders. - Role-Based Configuration
Create tailored dashboards for different user groups (e.g., operators, reliability engineers, management), exposing only the metrics and charts relevant to each role.
Open Access & Integrations
- Full REST API with Swagger
APM Studio publishes a fully documented Swagger definition, allowing you to pull any data or analytics results via REST endpoints. This is ideal for integration into your existing data pipelines or third-party tools. - Extend to PowerBI, Grafana, and Beyond
Since all APM Studio data can be accessed programmatically, you can easily incorporate it into external dashboards—such as PowerBI, Grafana, or custom web applications—to unify insights across your organization. - Other Interfaces
In addition to the REST API, APM Studio supports a variety of data exchange mechanisms (CSV, MQTT, OPC UA, etc.), giving you multiple options to query, extract, or push data as needed.
By combining built-in web-based dashboards with open data interfaces, APM Studio ensures you can visualize operational information in the environment that works best for your team. Whether you prefer leveraging APM Studio’s native charts or integrating with external platforms, APM Studio provides the flexibility to support all your real-time monitoring and analytics needs.
Ready to take the first step?
Book a call with Artur Loorpuu, Senior Solutions Engineer in Digitalization, who specializes in turning industrial challenges into practical digital solutions. With deep expertise in digitalization and process optimization, Artur collaborates with clients in the process industry to reduce costs, enhance efficiency, and drive innovation.
Let’s explore how we can support your goals!